 This project has been on the boil for a while now, but I've finally got round to finishing it off to my satisfaction.
I always wanted to see the elevation plot of my routes and rides but never really found somewhere I could get it from so after finding some code to parse the gpx log I've spent a long time fettling the output.
Here's what you need to do:
Set up some directories
First step, put them wherever you like but if you've no preference try this:
mkdir -p ~/bin/gpx
cd @/bin/gpx
Install GNUPlot and Python3
Fire this into your terminal:
sudo apt install gnuplot python3
GPXPlot.py
This little beauty converts the GPX file from XML to a flat datafile. When I first embarked on this journey I was using Python2 but things are moved along a bit since then so I've had to update the code for then changes in Python3. you can download the revisions I made here or from the command line with this:
wget https://github.com/mc3k/gpxplot/blob/4b2ac1d8250cfbbc6a07690ac80ae6f5c2473e80/gpxplot.py
elevplot.sh
This is the script which brings it all together - it converts the GPX file and then sets up the code for GNUPlot to output the elevation profile. Download it / copy'n'paste it into a file from my GitHub Gist:
Usage
Simples, just bang out a this terminal code:
./elevplot.sh yourtrackfile.gpx ['chart title']
first argument is the name of your gpx track or route file and then you can optionally you can add a title to the chart. The script will then output and image for you
Nice touches
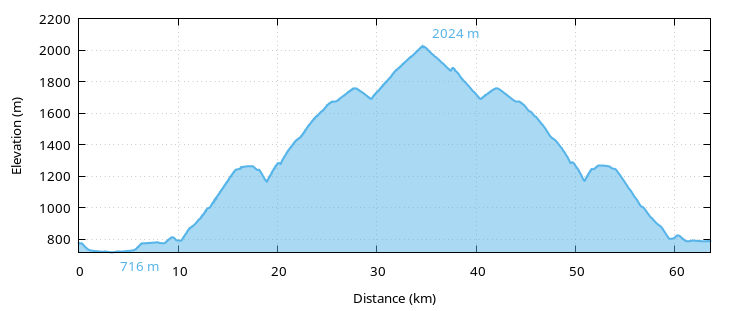
I'm actually quite happy with the final look it outputs, it took a lot of finessing but I eventually managed it. I'm liking the minimum and maximum height labels (click for larger image):
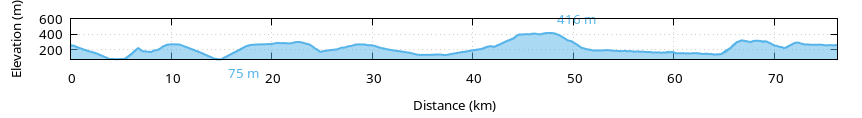
And you'll also note that the size of the image does change depending on the elevation and length of track - this is intentional as I find that when you usually see a profile the scale is skewed and usually underplays the monster climbs I've just cycled. With that in mind the file size is dynamic which you can see from the two profiles in this post - both the same length but in comparison between the two rides, the Croix de Fer one shows the true magnitude of the climb.
