Articles
How to create real time graphs of CPU temperature on a Raspberry Pi
3 November 2015 RaspberryPi
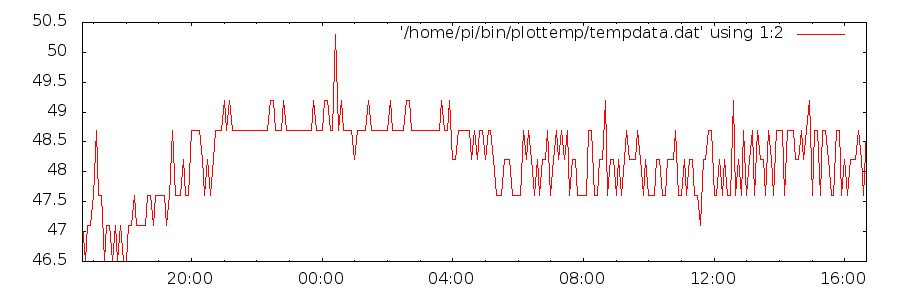
Probably heavily linked with my inner analyst, for a while now I've wanted to create some real-time graphing of some of my raspberry pi stats. I've had a couple of stabs at it but getting it to actually work has eluded me until now.
The below example guides you through how to plot your CPU temp as a graph to an image file, the code is in my github more »
Subscribe to newsletter

- Installing signal-cli Signal messenger on a Raspberry Pi
- How to change the date format of a time series axis in Grafana
- How to download Fritzing for free (and from a reputable source)
- How to calculate Heat Index using an SQL function in MariaDB
- Quick way to switch to a USB WiFi adaptor on your Raspberry Pi
- Alignements de Carnac
- How to install Filebrowser as a service using www-data as the user on a Raspberry Pi
- How to install Raspberry Pi's SD Card Copier on your non Raspian Linux machine
- How to print an array as a HTML table in PHP
- How to switch your WiFi connection to a USB WiFi adaptor on your Raspberry Pi
- How to easily broadcast the hostnames of other devices on your network using a RaspberryPi or any linux machine
- Fix "-bash: mail: command not found" error on RaspberryPi
- Fix "Cannot open mailbox /var/mail/USER: No such file or directory" error message
- Vanlife 2024 Overview
- Create an elevation profile from a gpx file